
Reasons to Focus on LT Instead of Heart Rate
Introduction
"I don’t feel exhausted, but my heart rate is too high."
"To stay in Zone 2, I have to slow down to a walking pace."
Heart rate is a widely used metric for defining training zones, especially with the increasing accessibility of smartwatches that provide real-time heart rate data. Many athletes and fitness enthusiasts rely on heart rate to gauge training intensity. However, heart rate-based training zones don’t always align perfectly with an individual’s actual exertion level. Some people experience disproportionately high heart rates even at low intensities, while others maintain relatively low heart rates even at maximum effort. This variation arises because heart rate is influenced by multiple physiological and external factors.
A more precise and physiologically relevant method for determining training zones is Lactate Threshold (LT). By analyzing blood lactate accumulation, LT provides an objective measure of metabolic stress and endurance capacity, offering a more accurate framework for setting training intensity than heart rate alone.
Lactate and LT
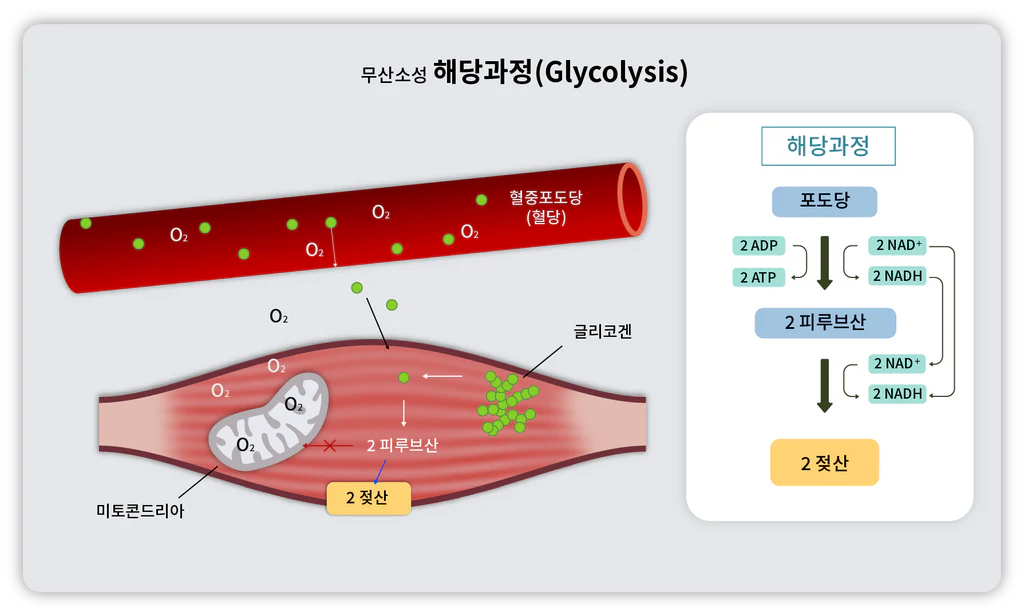
Lactate is a byproduct of anaerobic glycolysis, a metabolic pathway that rapidly generates energy when oxygen availability is limited. During exercise, glycogen is broken down into pyruvate, which typically enters the mitochondria for aerobic metabolism when oxygen is sufficient.
However, under conditions of increased energy demand and insufficient oxygen supply, pyruvate is converted into lactate. This occurs when the rate of glycolysis exceeds the oxidative capacity of mitochondria, leading to lactate accumulation. Once produced, lactate can either be oxidized back into pyruvate and used for aerobic metabolism or transported to the liver for gluconeogenesis. The balance between lactate production and clearance is dynamic and depends on exercise intensity and metabolic efficiency.
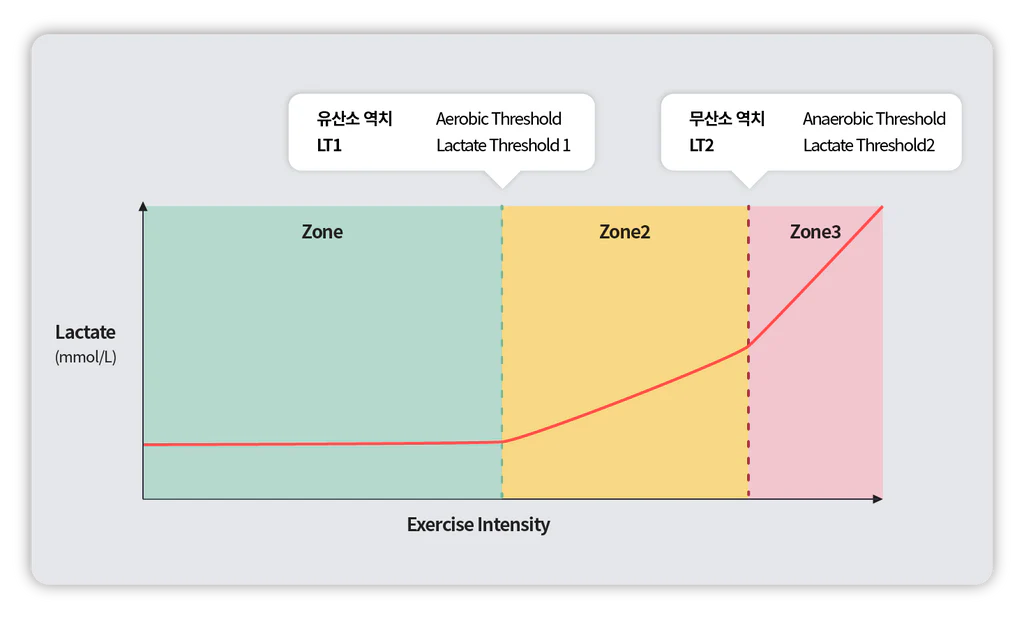
Lactate Threshold (LT) refers to the intensity at which lactate starts accumulating in the blood at a rate that exceeds its clearance. Since excessive lactate buildup leads to metabolic acidosis and muscular fatigue, LT serves as a key physiological marker of endurance performance. There are two primary threshold points:
- LT1 (Aerobic Threshold) – The point where lactate begins to accumulate slightly but remains stable, allowing prolonged exercise.
- LT2 (Anaerobic Threshold) – The point where lactate accumulates rapidly, leading to decreased muscle efficiency and an inability to sustain effort for extended periods.
The corresponding intensities at which these thresholds occur are known as Lactate Threshold Points (LTPs) and are critical in structuring endurance training.
How to Measure LT?
Lactate threshold can be assessed using two primary methods: direct blood sampling and respiratory analysis.
The blood sampling method involves a progressive exercise test where blood samples are collected at increasing intensities. By measuring blood lactate concentration at each stage, the point at which lactate begins to accumulate rapidly can be identified. This method provides direct and precise data on metabolic shifts but requires specialized equipment and is more invasive.
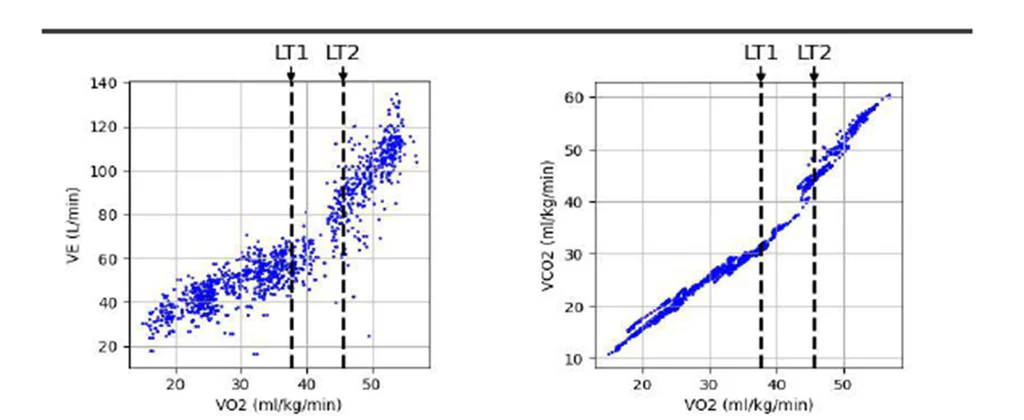
The respiratory analysis method estimates LT non-invasively by evaluating changes in oxygen uptake (VO₂) and carbon dioxide output (VCO₂). As lactate accumulates, blood acidity rises, stimulating the respiratory center and triggering hyperventilation. This leads to an increase in CO₂ exhalation relative to oxygen uptake, altering breathing patterns. By analyzing these respiratory shifts, the lactate threshold can be identified without the need for blood sampling.
Both methods are widely used in exercise physiology, often in combination, to improve accuracy in determining an athlete’s optimal training intensity.
LT and Training Zones
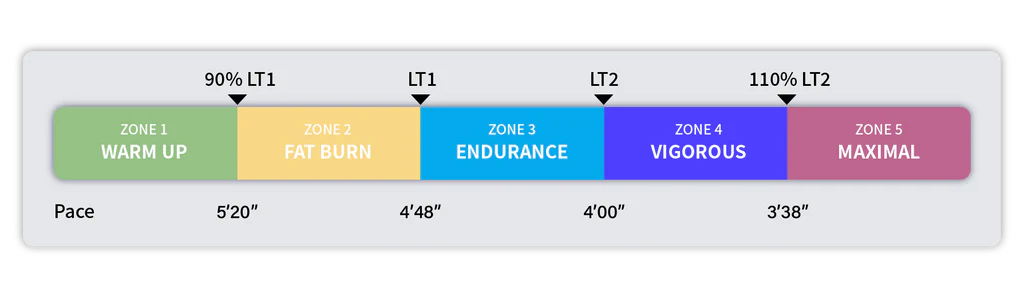
LT provides a more precise basis for defining training zones than heart rate alone. The relationship between lactate accumulation and training intensity can be categorized as follows:
- Below LT1 (Zones 1 & 2)
- Oxygen supply is sufficient to match energy demands, minimizing lactate accumulation.
- Lactate is efficiently recycled into pyruvate or converted back into glucose in the liver.
- These zones correspond to low-intensity aerobic training, such as long slow distance (LSD) runs, recovery sessions, and light jogging.
- Between LT1 and LT2 (Zone 3)
- Lactate production gradually outpaces clearance, but aerobic metabolism remains dominant.
- This is the "steady-state endurance" zone, commonly used for tempo runs and marathon pace training.
- Above LT2 (Zones 4 & 5)
- Anaerobic metabolism becomes the primary energy source, leading to rapid lactate accumulation.
- Clearance mechanisms cannot keep up, causing a steep rise in blood lactate levels and muscular fatigue.
- This zone includes high-intensity training such as threshold runs, interval training, and HIIT (High-Intensity Interval Training).
So, let's utilize LT
Lactate accumulation directly reflects the metabolic stress imposed by exercise, making LT a superior benchmark for determining training intensity. Many elite endurance athletes, including marathoners, cyclists, and triathletes, structure their training around LT-based zones rather than relying solely on conventional heart rate models.
While heart rate correlates with LT to some degree, it is an indirect and sometimes unreliable measure of exertion. Heart rate can fluctuate significantly due to external factors such as sleep quality, caffeine intake, hydration status, and psychological stress. Some individuals experience disproportionately high heart rates with minimal effort, while others have blunted heart rate responses even at maximal intensity. Because of these variabilities, training zones based on percentage of maximum heart rate (HRmax) can be imprecise.
Today, LT is widely recognized in exercise physiology and sports science as a critical metric for performance assessment and training optimization. It is also used in clinical settings for rehabilitation and chronic disease management. By incorporating LT alongside heart rate data, athletes and fitness enthusiasts can develop a more accurate, personalized, and effective training plan.
If you’re looking for a more precise way to structure your training, why not give LT-based training a try?
References
- Brooks, G. A. (2005). Exercise physiology: Human bioenergetics and its applications.
- Friel, J. (2024). The triathlete's training bible: The world's most comprehensive training guide. Simon and Schuster.
- Kenney, W. L., Wilmore, J. H., & Costill, D. L. (2022). Physiology of sport and exercise. Human Kinetics.
- Beaver, W. L., Wasserman, K., & Whipp, B. J. (1986). A new method for detecting anaerobic threshold by gas exchange. Journal of Applied Physiology, 60(6), 2020-2027.
- Caiozzo, V. J., Davis, J. A., Ellis, J. F., Ãzus, J. L., Vandagriff, R., Prietto, C. A., & McMaster, W. C. (1982). A comparison of gas exchange indices used to detect the anaerobic threshold. Journal of Applied Physiology, 53(5), 1184-1189.
- Haugen, T., Sandbakk, Ø., Seiler, S., & Tønnessen, E. (2022). The training characteristics of world-class distance runners: An integration of scientific literature and results-proven practice. Sports Medicine-Open, 8(1), 46.
- Kenneally, M., Casado, A., & Santos-Concejero, J. (2018). The effect of periodization and training intensity distribution on middle- and long-distance running performance: A systematic review. International Journal of Sports Physiology and Performance, 13(9), 1114-1121.
- Seiler, K. S., & Kjerland, G. Ø. (2006). Quantifying training intensity distribution in elite endurance athletes: Is there evidence for an “optimal” distribution? Scandinavian Journal of Medicine & Science in Sports, 16(1), 49-56.
- Stöggl, T. L., & Sperlich, B. (2015). The training intensity distribution among well-trained and elite endurance athletes. Frontiers in Physiology, 6, 295.
